Intro to the Status Page: Logging in ArcESB
ArcESB's Status page displays logs and metrics that can be used to track the performance and status of the application.
This is a beginner's guide to the information available in the Status page, including:
Together, these tools make monitoring ArcESB's data flows simple. For help getting started with ArcESB's data integration tools, please see our Introduction to the Flows Page.
Transaction Log

Each entry in the Transaction Log corresponds to a file being processed by a connector in an ArcESB flow. Connectors can operate on files in several ways, each of which is considered a "transaction":
- Downloading & receiving data from an external source and writing it to a file
- Uploading & sending data from a local file to an external destination
- Transforming & manipulating the format or data of a local file
Transaction Log entries include data specific to a particular transaction: the name of the file, the timestamp of the transaction, the status (Sent, Received, Error) of the transaction, the connector that performed the transaction, etc.
Each entry in the Transaction Log can be expanded by clicking the + button on the left side of the entry row or by clicking the filename. The expanded log entry shows any log files written as part of the transaction. Specific transaction types will have specific log files, for example an AS2 transaction may include an MDN receipt as one of the Transaction Log files.

If the application records a failed transaction in the Transaction Log and then successfully sends or receives that file at a later time, the Transaction Log will overwrite the Send Error or Receive Error entry with the corresponding successful entry. Note, the log files for the failed transactions will still be available when expanding the entry in the Transaction Log.
Searching the Transaction Log
The search function in the Status page allows for filtering out specific transactions. For example, searching for a specific connector name will show only files processed by that connector.
By default, the Transaction Log supports searching for timestamps, connector names, and filenames. The search strings can be partial; for example, searching for "edi" will match all filenames that end in an ".edi" extension as well as any connector names that include "edi" (ignoring case).
In addition to the default search criteria available for any transaction, searchable custom metadata can be added to files within the ArcESB flow. Once metadata is added to the files in the form of headers tracked by the application, these headers can be searched in the Transaction Log like any other transaction detail. To learn more about adding custom metadata to files, see our full Logging documentation.
Application Log

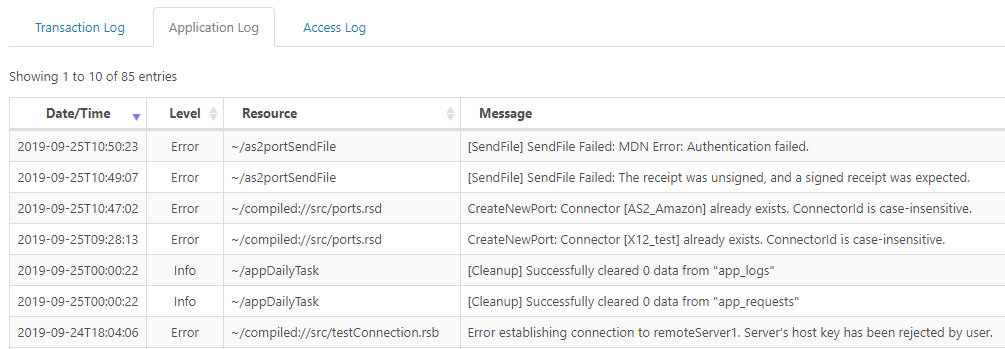
The Application Log includes entries for any errors that occur at the application level, which is a broader scope than just errors specific to a particular file transaction. For example, if the application is unable to open a digital certificate store, the resulting error is not associated with a specific file processed by the application but is still recorded in the Application Log.
In addition to application-level errors, the Application Log also includes any instances of authorized access to application resources. For example, this log includes Admin API requests that manage the application from a remote machine, or daily cleanup tasks that archive and/or delete old logging data.
Any errors that prevent ArcESB's automated tasks from running are logged in the Application Log. If files are not properly being sent or received in an automated configuration, check the Application Log for relevant errors.
The Application Log also records any failures to route messages within the ArcESB flow. For example, when the application receives an AS2 message, but does not recognize the sender of the message (and so cannot route the message to an AS2 connector configured for that sender), the application will log this failure in the Application Log.
Access Log

The Access Log records any attempt to reach the web server hosting ArcESB. This includes:
- Files sent over web-based protocols (AS2, AS4, etc)
- Admin API requests for managing the application from a distance
- Remote access of web endpoints published within the application (such as custom APIs built with the API Connector)
The Access Log can be used to diagnose general connectivity issues between ArcESB and a remote trading partner. If remote parties are attempting to send data over a web protocol and this data is not arriving in the ArcESB flow, the Access Log demonstrates whether these web requests are reaching the application at all. If the Access Log does not include an entry for the partner's web requests, then the connectivity issue occurs before ArcESB ever "sees" the data (often this is the result of firewall interference or other network conditions).
If the Access Log includes an entry for data sent from a remote party, but this data is not properly entering the ArcESB flow, check the Application Log for errors related to interpreting or routing the received message.
Usage Metrics
In addition to logging, the Status page includes a visual representation of application usage.

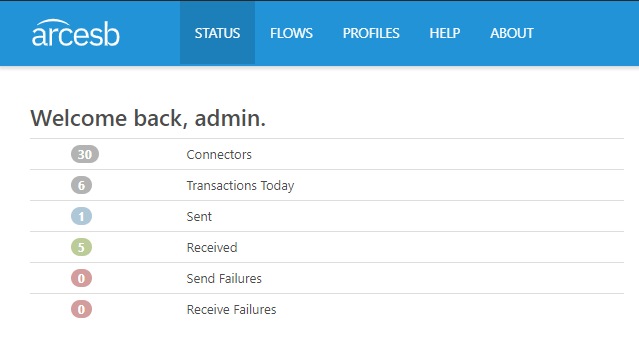
The number of configured connectors can be viewed in the top left of the page, as well as the number of transactions processed by these connectors during the current day. The application further divides these transactions into successful and failed Sends, as well as successful and failed Receives. Any operations on local file data (such as converting a CSV file into XML) are considered Send operations.
The graph on the right side of the page visualizes the transactions processed by the application. These transactions are grouped by hour (when the graph is set to display the activity from the past 24 hours), by day (when the graph is set to display the activity from the past 7 or 30 days), or by month (when the graph is set to display the activity from the past 12 months).
Status Page: An Intuitive Application Overview
The Status page in ArcESB brings troubleshooting and data tracking together in a single, easily managed display. Here, you will find everything you need to gain a window into your file transfers, data movements and flows.
If you are looking for additional information regarding logging errors or issues, see our Logging documentation or contact our support team.
Ready to get started?
Learn more about ArcESB or download the free single-connector license:
